Algorithm
The design is based around the 4-step algorithm which decomposes the full 224 NTT into multiple 212 NTTs across columns and rows of a 212 x 212 matrix. The 4-step algorithm is described in section 7.1 of this paper. Here's a summary of what it is:
1. Layout the 224 size input data as a 212 X 212 matrix in row-major order (ie: mat[i][j] = data[i * 2^12 + j])
2. Perform a length-212 NTT along all columns and write the results back in place
3. Multiply mat[i][j] by x^{i * j}, where x is the N-th root of unity of the underling field, and N = 224
4. Perform a length-212 NTT along all rows and write the results back in place
5. Tranpose the matrix
The overall complexity (in terms of butterfly operations performed) is roughly equivalent to a single 224 INNT, though an extra twiddle factor correction pass (ie: step 3) is required between the column and row phases.
On the otherhand, onchip memory usage is drastically reduced, and it becomes possible to implement multiple smaller INNT cores for improved performance through parallelism.
Our Implementation
We implemented our NTT core on top of the Vitis platform for Varium C1100. This platform provides us with the PCIe and HBM interfaces. As such the design is provided as Vitis kernels which are put together to provide the final architecture.
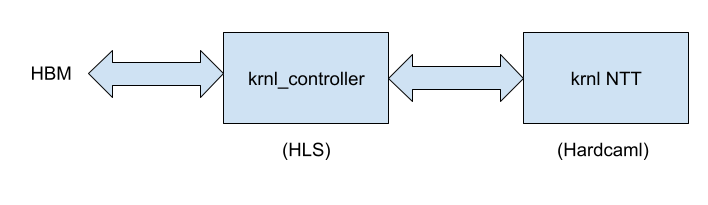
There are 2 Vitis kernels involved in our implementation:
- Hardcaml RTL Kernel implementing the core NTT algorithm
- C++ HLS Kernel which sequences PCIe and HBM memory accesses
Our implementation can be parameterized by the number of cores it supports - the only requirement is it has a power of 2 and there must be at least 8 cores (and subject to resource limits on the FPGA). Each of these cores is capable of performing a 212 NTT using on-chip memory.
2 Phases to Compute the NTT
Our actual NTT implementation comprises of two phases. Let C be the number of parallel NTT cores in our design.
(in actuality, our design scales by blocks of 8 cores, but it's easier to think in terms of cores)
Phase 1: Performs steps 1, 2 and 3 of the algorithm
- The HLS kernel streams the first C columns via AXI Stream to the Hardcaml kernel from a HBM bank
- The Hardcaml RTL kernel accepts the NTT
- The HLS kernel concurrently writes the results of the into a different HBM Bank
Phase 2: Performs step 4 and step 5 of the algorithm simultaneously.
- The HLS kernel stream rows to the hardcaml kernel via Axi Stream
- The Hardcaml RTL kernel perform the NTT and sends the results back via Axi stream
- The HLS kernel concurrently writes it back in columns - this implicitly performs a matrix transpose without the dedicated step
For a more thorough discussion on the design of individual NTT-cores, please refer the Hardcaml_ntt page.
Memory Bandwidth and Streaming
THe 4 step algorithm requires both a coloumn and row transform, with transposes between phases. This is performed both by controlling the memory access pattern (normal layout build) or by pre and post processing the input/output matrices (optimized layout builds).
One significant issue we have faced with this project is the bandwidth performance of HBM. In normal layouts, we tend to burst 64 to 512 bytes before opening a new row. The row open operation appears to be taking upto 200-250 HBM clock cycles (about 100 cycles at our internal 200 Mhz clock). We had expected significantly better performance from HBM than this and lacked time to try tuning various HBM parameters to see if we could get better performance.
The optimized layouts use the host for pre/post processing and dramaticlly improve bandwidth efficiency - the smallest transfers are now 2048 - 4096 bytes (which is only for one read phase - the other read/write phases are completely linear).
We see tremendously improved throughput of the core with this scheme, though we expect it to be judged harshly in this competition due to the extra pre/post processing step. We include it none-the-less as it shows the potential performance we can get to with either a more optimised HBM structure, or different memory architecture (like DDR4).
Experiments
To evaluate our results, we perform 2 sets of experiments.
Normal-layout Builds
These are builds where the input and output vector to perform NTT on is laid out linearly in HBM (ie: the host doesn't perform any pre/post-processing). We run experiments with running the 8-core, 16-core, 32-core and 64-core variants, yeilding different levels of parallelism.
Optimized-layout Builds
As discussed in the preceeding section, our performance is significantly bound by bandwidth. We conduct 2 builds (32-core and 64-core variant) with a simple data-rearrangement preprocessing step such that the host can stream data in 2048-4096 byte bursts.
Results (For Competition Criteria)
We have tested our design and ran builds on a 6-core Intel(R) Core(TM) i5-9600K CPU @ 3.70GHz machine with Ubuntu 22.04 LTS (GNU/Linux 5.15.0-48-generic x86_64). We did not use any special kernel flags / boot parameters to obtain our results. We run our designs using the Vitis platform Xilinx has provided for the Varium C1100 card. The platform takes up some resources on the FPGA and comes with PCIe gen3 x4 support
We measured our latency by taking the FPGA-only evaluation latency across 200 NTT runs. Power was measured by sampling xbutil examaine --report electrical
--device <device-pcie-id> 10 times during the latency benchmark.
In this normal layout build, we do not perform any preprocessing or post-processing. Hence, latency below includes only the FPGA NTT evaluation latency.
Latency, Power and Resource Utilization
The table below depicits our results for various builds
|------------------------------------------------------------------------------|
|   Build | Latency(s) | Power(W) | LUTS   | Registers |  DSP | BRAM36 | URAM  |
|------------------------------------------------------------------------------|
|  8 core |     0.2315 |    16.97 | 107291 |    141006 |  260 |    162 |   48  |
| 16 core |     0.1238 |    18.19 | 126422 |    156149 |  512 |    162 |   96  |
| 32 core |     0.0691 |    21.13 | 166488 |    184436 | 1028 |    162 |   192 |
| 64 core |     0.0450 |    27.70 | 265523 |    246385 | 2052 |    162 |   384 |
|------------------------------------------------------------------------------|
Here are the available resources on the FPGA. Note that as we are building on top of a Vitis platform, it imposes a non-trivial fixed-cost that we don't control. The number is reported as "fixed" in the post_route_utilization.rpt
----------------------------------------------------------
| Resource  | Available on FPGA | Used by Vitis Platform |
----------------------------------------------------------
|      LUTS |            870720 |                  62191 |
| Registers |           1743360 |                  81502 |
|       DSP |              5952 |                      4 |
|    BRAM36 |              1344 |                      0 |
|      URAM |               640 |                      0 |
----------------------------------------------------------
FOM Measurement
Here are our FOM numbers. As detailed in the evaluation criteria given to us, FOM is computed as latency * sqrt(Power) * U_norm. Note that N_pipe = 1 for our design, since it can only support 1 evaluation at a time.
Latency and Power is used as report above in seconds and Watts respectively. We calculate U_norm = U(LUTS) + U(Registers) + U(DSP) + U(BRAM) + U(URAM). The max possible value of U_norm is hence 4.0, since 0 <= U(.) < 1.0
These are FOM numbers assuming we don't include the platform (aka fixed resources) in our utlization
------------------------------------------------------------------------------
|                     Utilization (%)                      |        |        |
|  Build  |  LUTs  |  Registers |    DSP |   BRAM |   URAM | U_norm |  FOM   |
------------------------------------------------------------------------------
| 8-core  | 0.0518 |     0.0341 | 0.0430 | 0.1205 | 0.0750 | 0.3245 | 0.3095 |
| 16-core | 0.0749 |     0.0428 | 0.0860 | 0.1205 | 0.1500 | 0.4743 | 0.2505 |
| 32-core | 0.1198 |     0.0590 | 0.1720 | 0.1205 | 0.3000 | 0.7714 | 0.2451 |
| 64-core | 0.2335 |     0.0946 | 0.3441 | 0.1205 | 0.6000 | 1.3927 | 0.3301 |
------------------------------------------------------------------------------
Our best-build for the evaluation criteria is the 32-core variant, with a FOM of 0.2451
The following FOM numbers are assuming we have to include the Vitis platform resources as part of our utilization. To stress this fact -- we don't think those resources should be considered as part of the evaluation!
------------------------------------------------------------------------------
|         |             Utilization (%)                    |        |        |
|  Build  |   LUTs |  Registers |    DSP |   BRAM |   URAM | U_norm |  FOM   |
------------------------------------------------------------------------------
| 8-core  | 0.1232 |     0.0809 | 0.0437 | 0.1205 | 0.0750 | 0.4433 | 0.4229 |
| 16-core | 0.1463 |     0.0896 | 0.0867 | 0.1205 | 0.1500 | 0.5931 | 0.3132 |
| 32-core | 0.1912 |     0.1058 | 0.1727 | 0.1205 | 0.3000 | 0.8903 | 0.2829 |
| 64-core | 0.3049 |     0.1413 | 0.3448 | 0.1205 | 0.6000 | 1.5116 | 0.3583 |
------------------------------------------------------------------------------
Using these criteria, our best build is also the 32-core variant with a FOM of 0.2829
Result from Optimized-Layout Builds
Here is a detailed breakdown of a runtime sample of an optimized 64-core build: (The power and utilization is similar to the normal-layout builds)
// Breakdown of a 2^24 optimized-layout 64-core evaluation

----------------------------------------------------
|               Task                     |   Time  |
----------------------------------------------------
| Preprocessing data rearrangement       | 0.0213s |
| Copying input points to device         | 0.0414s |
| Doing Actual NTT work                  | 0.0267s |  (vs 0.0450s in normal layout)
| Copying final result to host           | 0.0552s |
| Copy from internal page-aligned buffer | 0.0231s |
|----------------------------------------|---------|
| Evaluate NTT                           | 0.1680s |
-----------------------------------------|----------

// Breakdown of a 2^24 optimized-layout 32-core evaluation

----------------------------------------------------
|               Task                     |   Time  |
----------------------------------------------------
| Preprocessing data rearrangement       | 0.0217s |
| Copying input points to device         | 0.0416s |
| Doing Actual NTT work                  | 0.0349s |  (vs 0.0691s in normal layout)
| Copying final result to host           | 0.0554s |
| Copy from internal page-aligned buffer | 0.0228s |
|----------------------------------------|---------|
| Evaluate NTT                           | 0.1770s |
-----------------------------------------|----------
By rearranging the data in a much more memory-friendly layout, our NTT evaluation time drops significantly compared to those of a 64-core build in a normal build (0.0267s vs 0.0450s). This comes at the cost of the host doing some data rearrangement.
The bottleneck of our evaluation clear lies in the host and PCIe latency in this result, both of which can be solved pretty easily:
- preprocessing + postprocessing > latency - We can run the preprocessing and post-processing in separate threads. We can setup the input and output buffers such such that we don't run into cache coherency issues. We can also mask some of the preprocessing latency with PCIe latency.
- The PCIe latency is larger than the NTT evaluation - This is because the vitis platform we are using only supports PCIe x4. With PCIe x16, we would have 4 times the bandwidth and side-step this problem.
In practice, we believe this is the more scalable design that can achieve low-latency and high-throughput, at the cost of the host machine doing some data rearrangement.
Build and Testing Instructions
Please refer this page